2122
2122Looking back at 2023, it seems that the overall economic situation did not progress as expected at the beginning of the year; in fact, in some aspects, there was even a trend of regression.
But for Tuke e-commerce, 2023 was a year of significant change.Although the situation was turbulent throughout the year, the myth of wealth creation surrounding it continued to unfold. Especially in the second half of 2023, when Tuke Shop fully opened its U.S. operations, a closed-loop of consumer market traffic was formed, and the sales of Tuke U.S. stores began to grow exponentially.
Therefore, joining Tuke Shop in 2024 is definitely a very good choice.
Recently, the "2023 Tuke E-commerce Industry Trend White Paper" was officially released (source: Chaodian Youshu). This report details the development trends of the Tuke e-commerce industry in 2023, including product selection, short video viral genes, regional consumer preferences, product pricing strategies, etc., and provides information on annual rankings and user ecosystem characteristics, as well as successful brand marketing cases. Through this report, Tuke hopes to help Tuke sellers better understand the current situation of the cross-border market in 2023 and prepare for marketing strategies in 2024.
The full version of the white papercan be obtained via WeChat, and the following is an excerpt from the report.

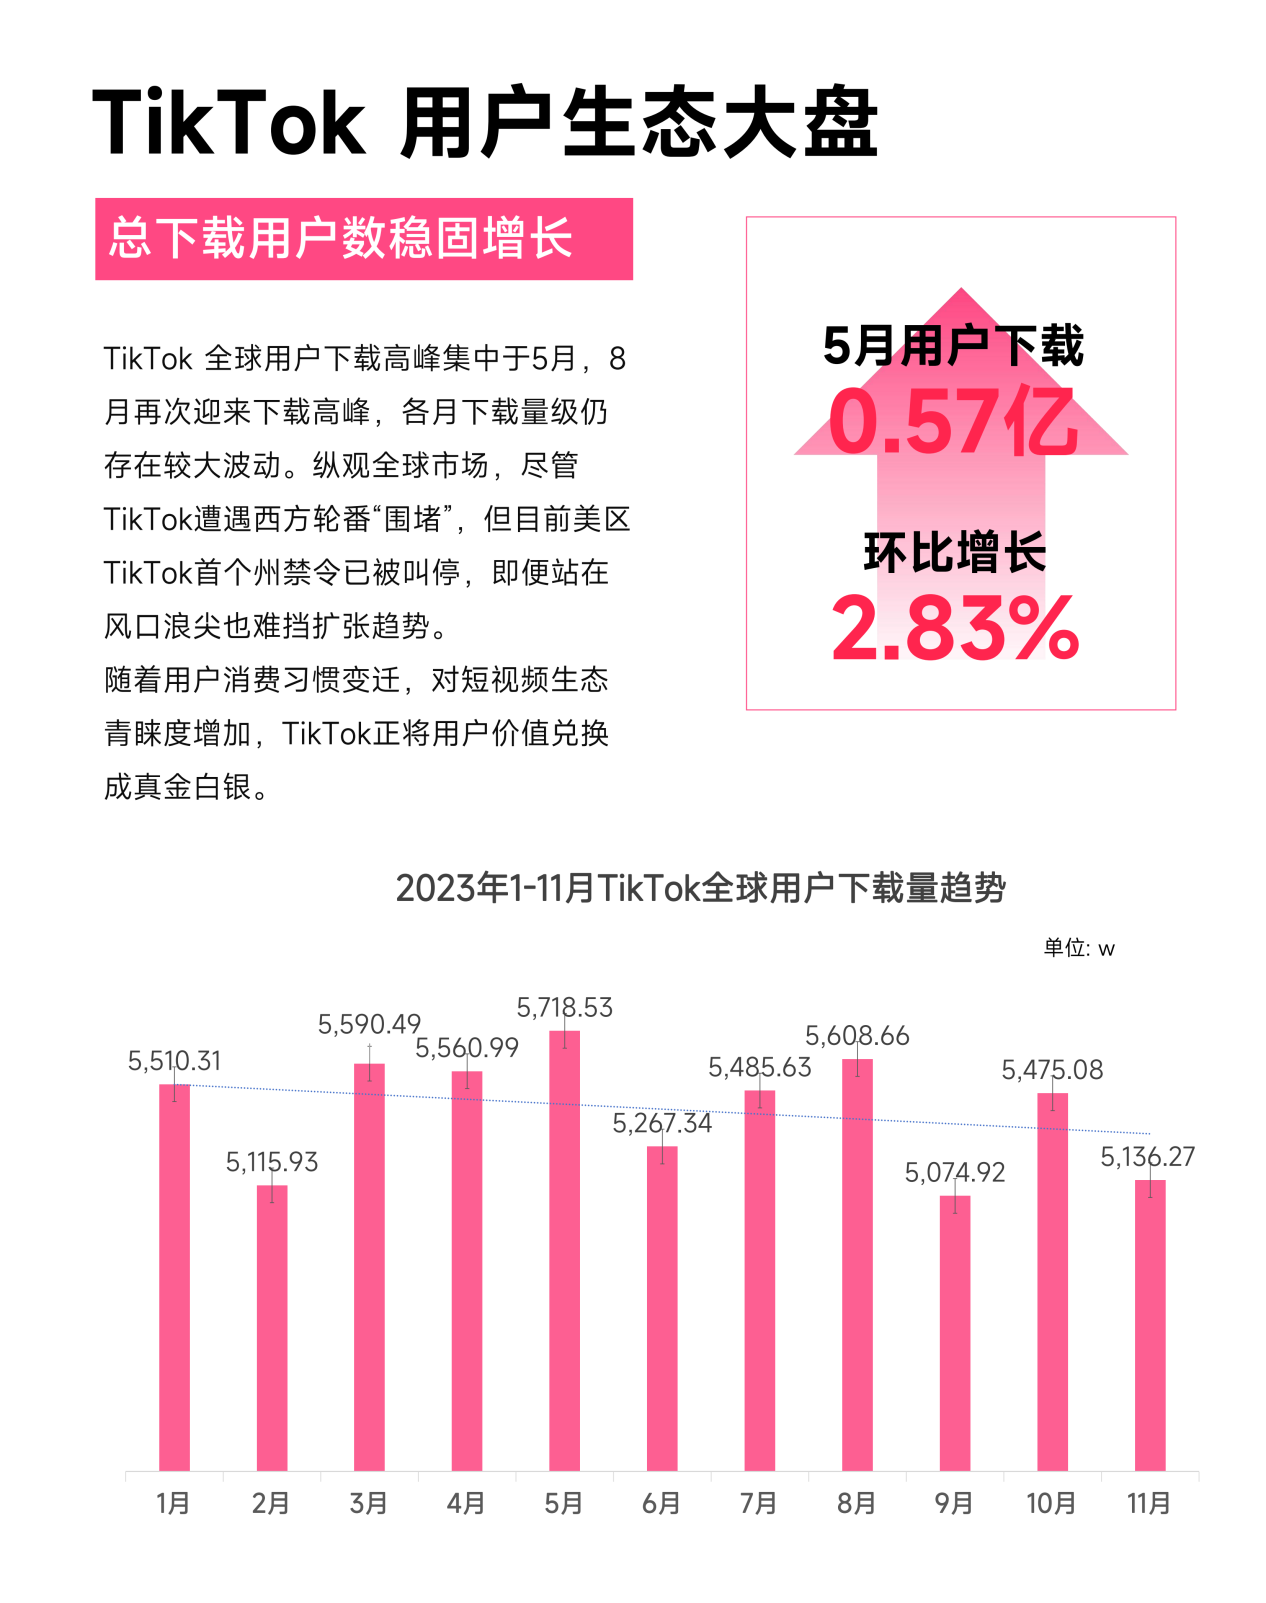
01 Tuke User Ecosystem Insights Empower Sales
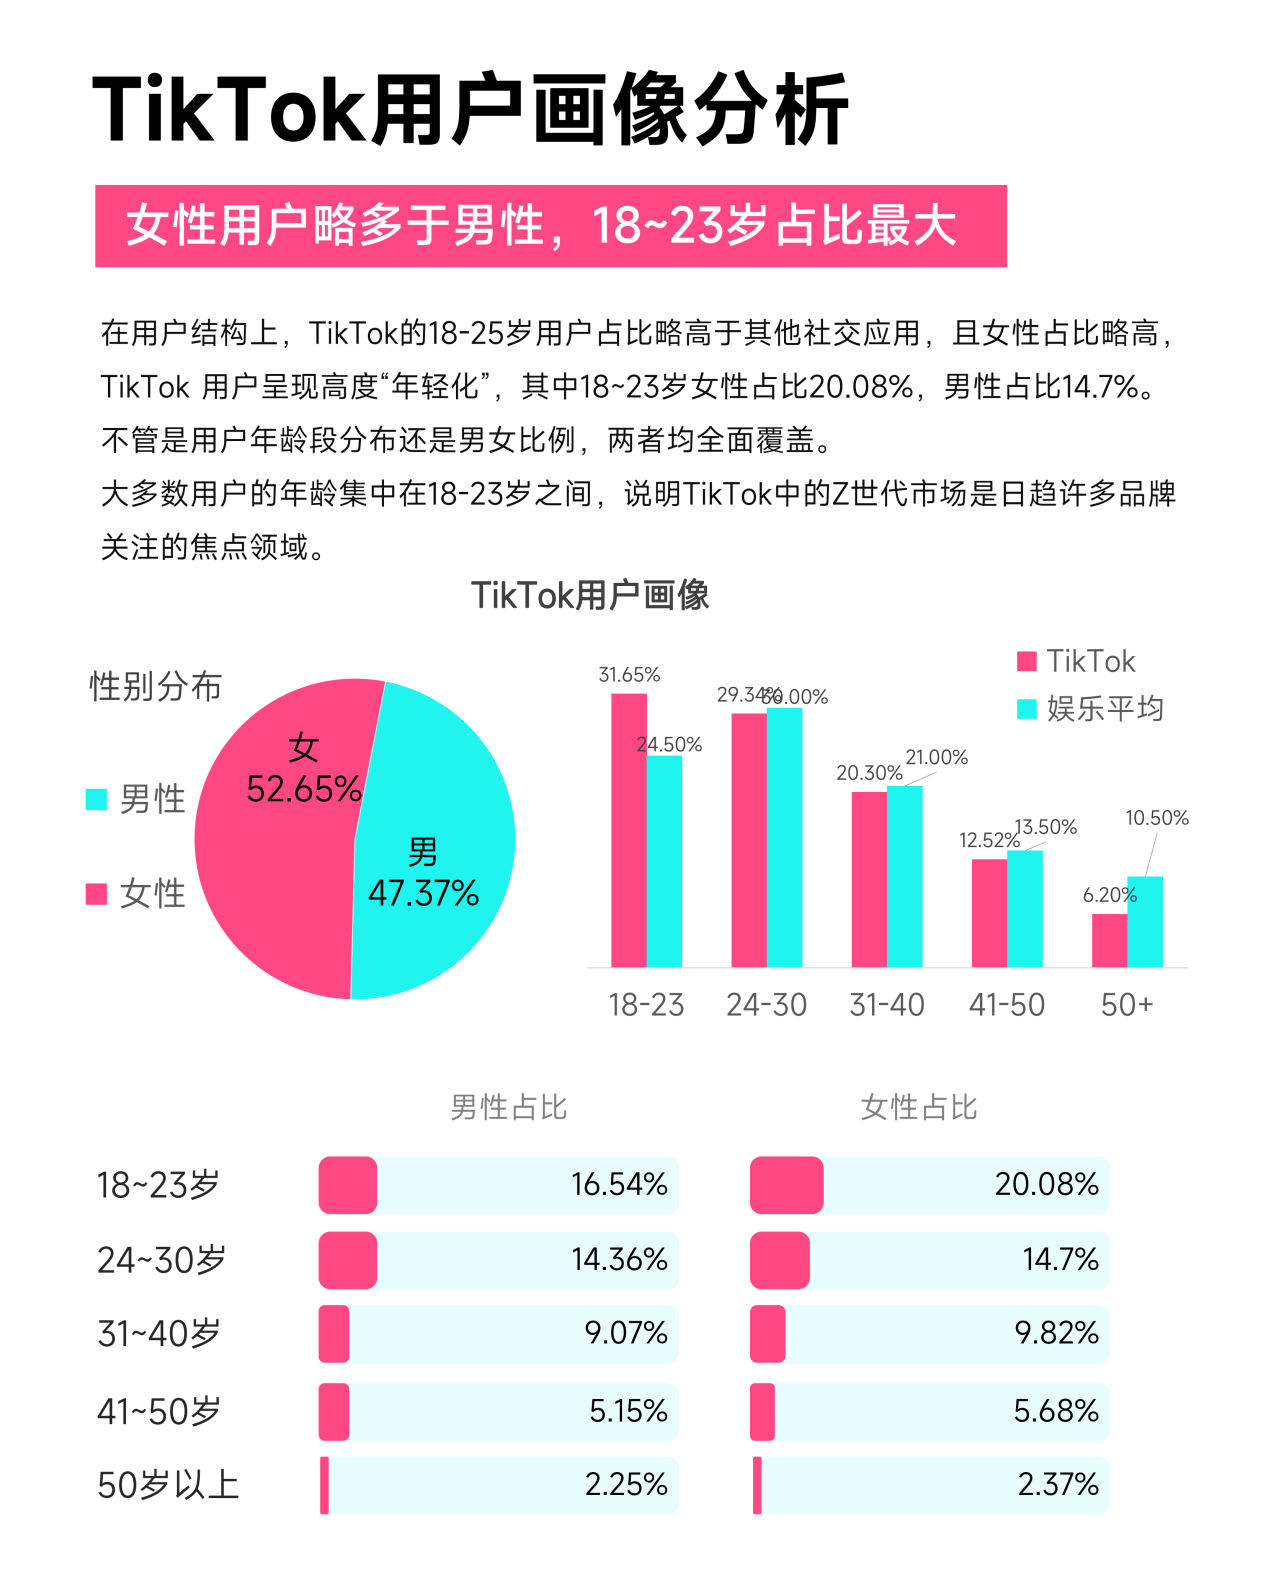
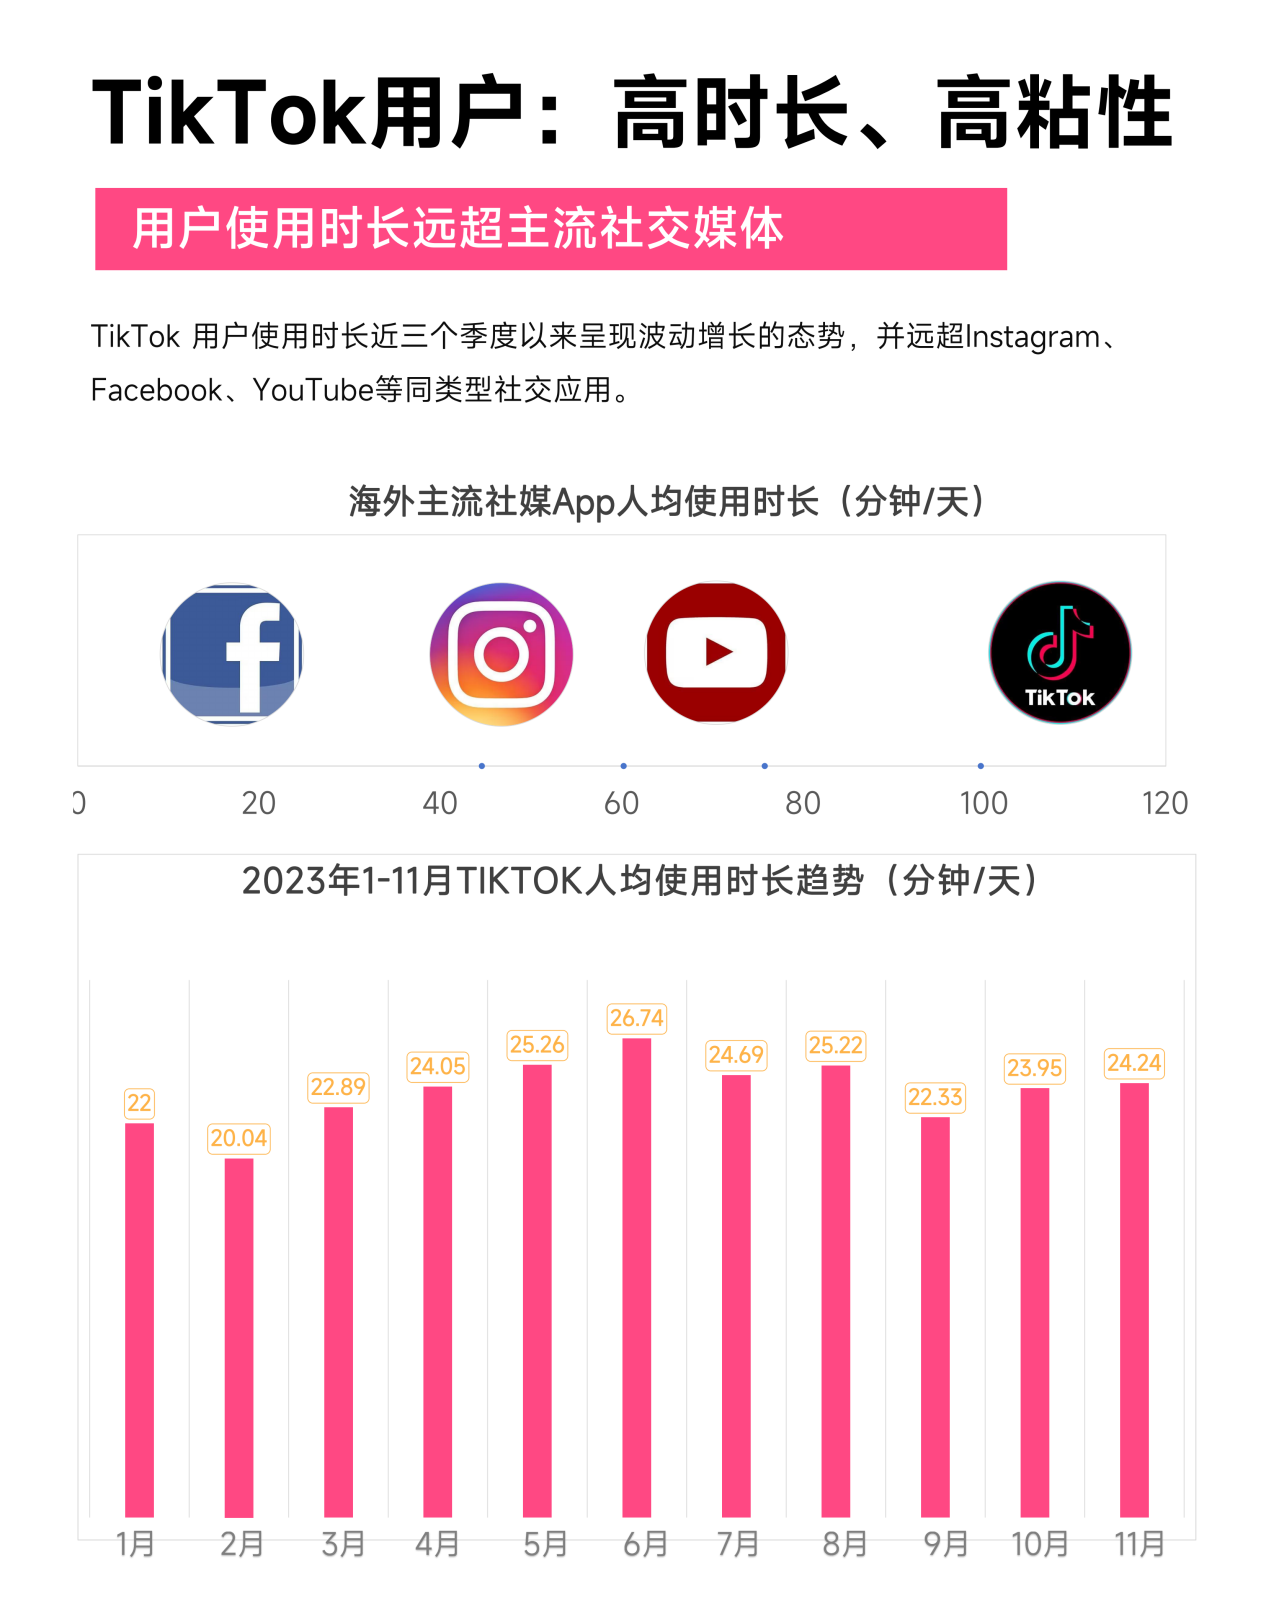
Tuke continues to demonstrate strong appeal worldwide, with user activity and usage time exceeding other social media platforms. This user ecosystem not only provides great potential for sales but also offers valuable insights and opportunities for sellers. By leveraging these insights, sellers can better understand their target audience, connect with potential customers, and improve sales performance.
02 Brief Analysis of Tuke Shop E-commerce Overview
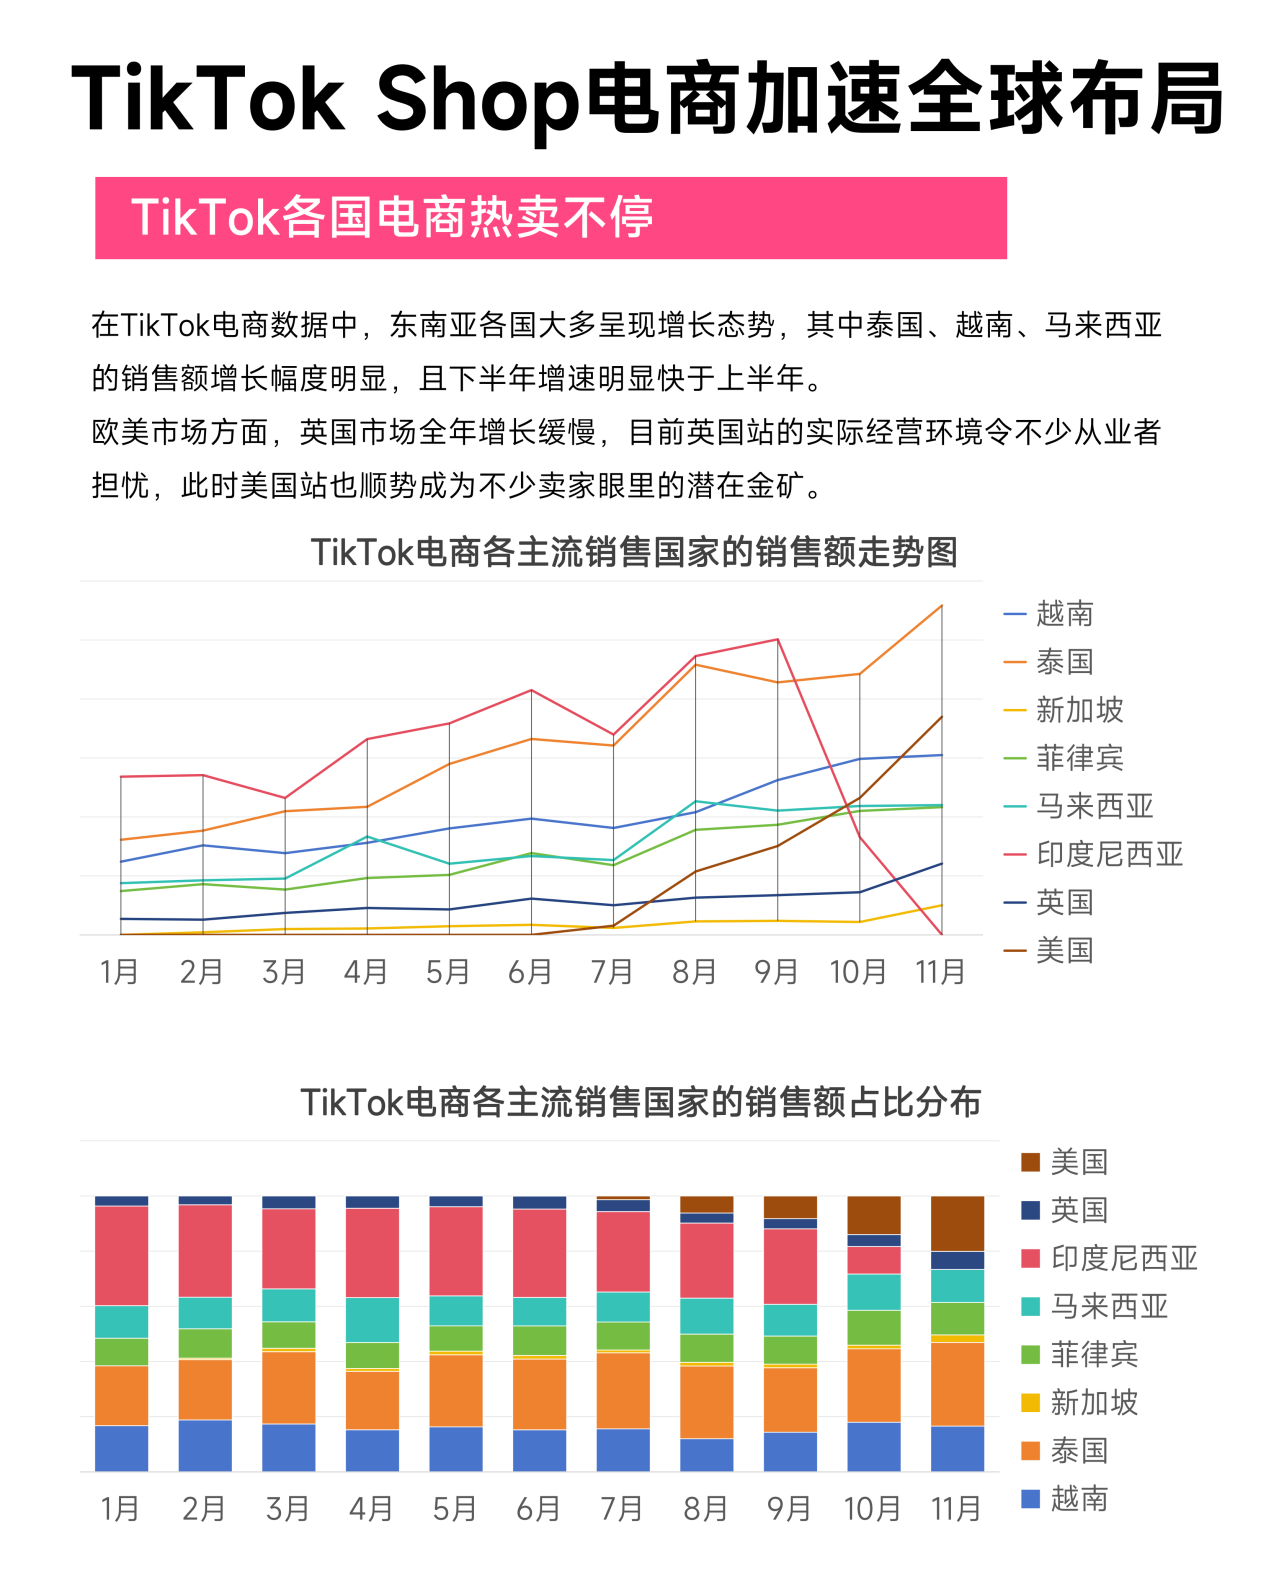
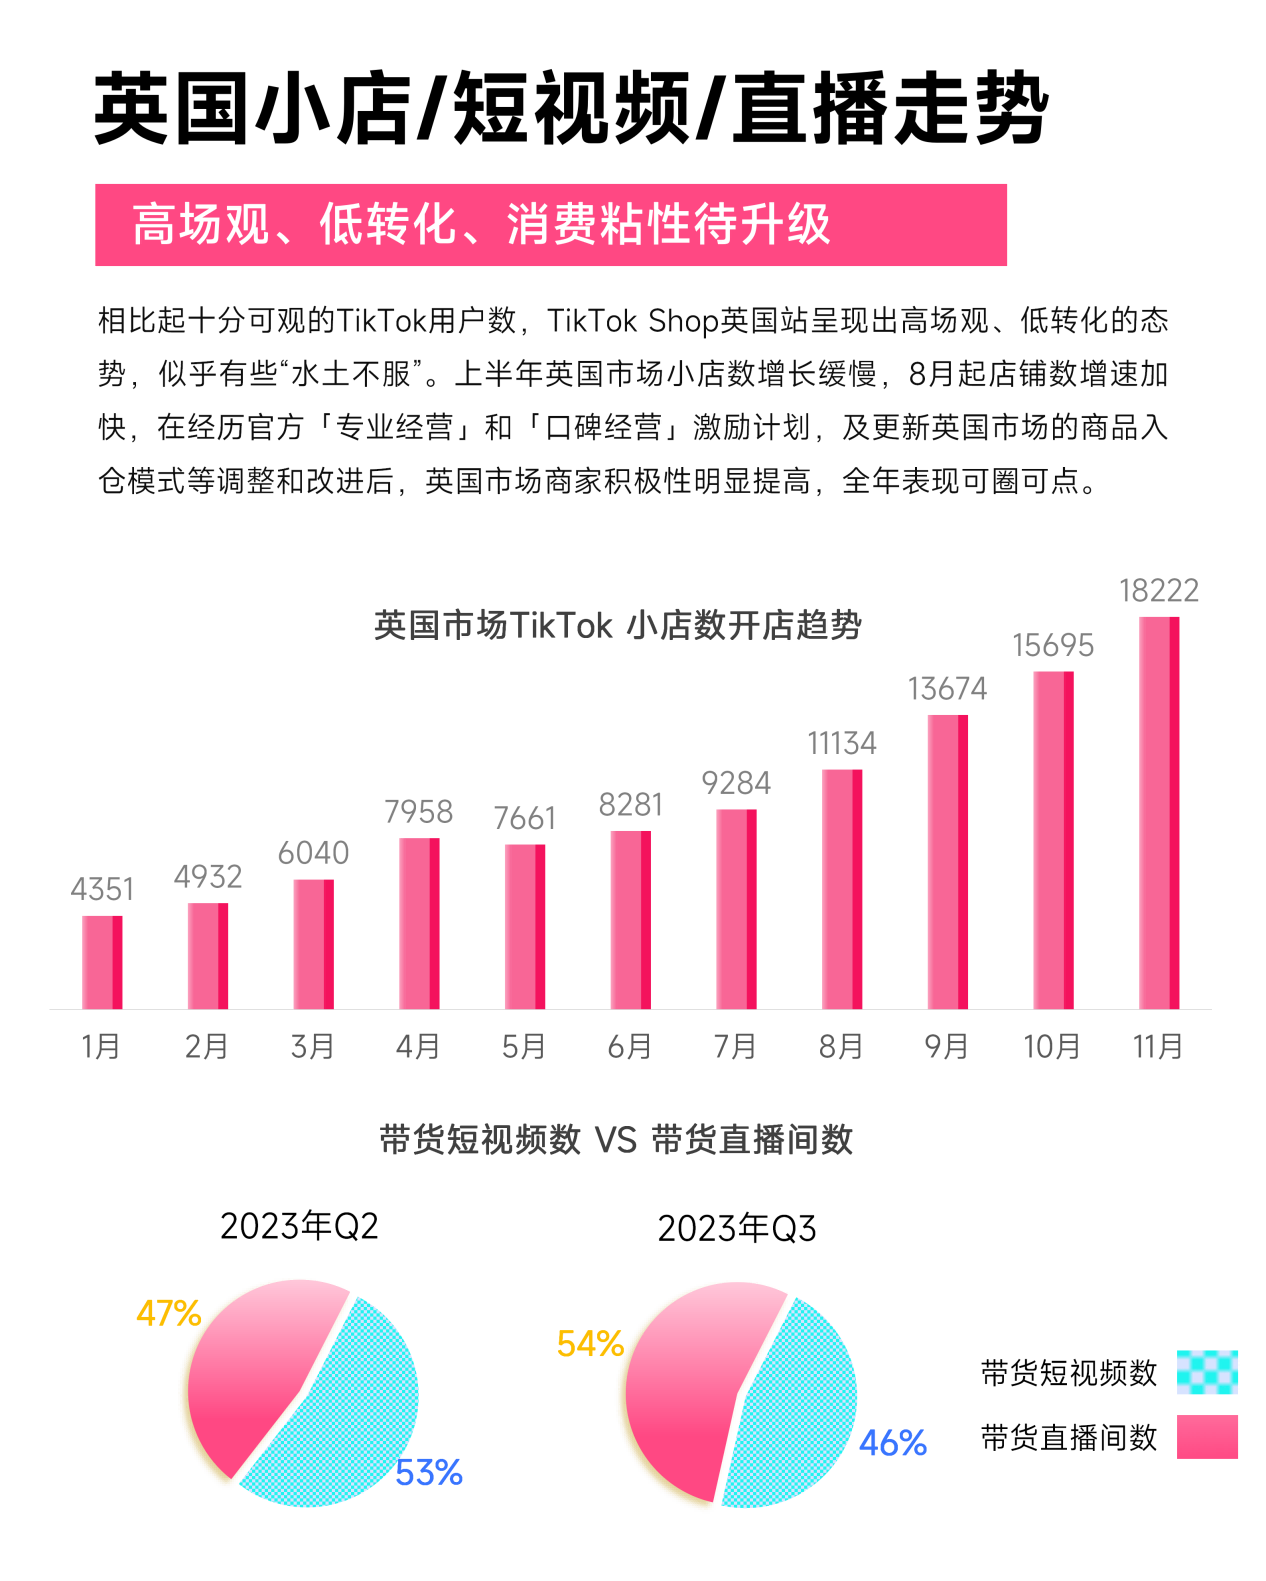
Looking at the performance of Tuke Shop in multiple Southeast Asian countries throughout the year, there was an overall growth trend, especially in the second half of the year, with a significant acceleration in growth rate. Among them, Thailand and Malaysia saw a month-on-month increase of over 40% in August, with outstanding market performance. However, the growth in the European and American markets, especially the UK, was not ideal throughout the year. Facing Tuke's ambitious e-commerce goal of $23 billion in 2023, the performance of the UK market was clearly unsatisfactory.
03 Annual Product Selection Trends + Viral Genes
Through the Chaodian Youshu big data product, we have deeply explored Tuke e-commerce market data and conducted cross-analysis on multiple indicators such as the number of products, sales volume, and the number of products with transactions.
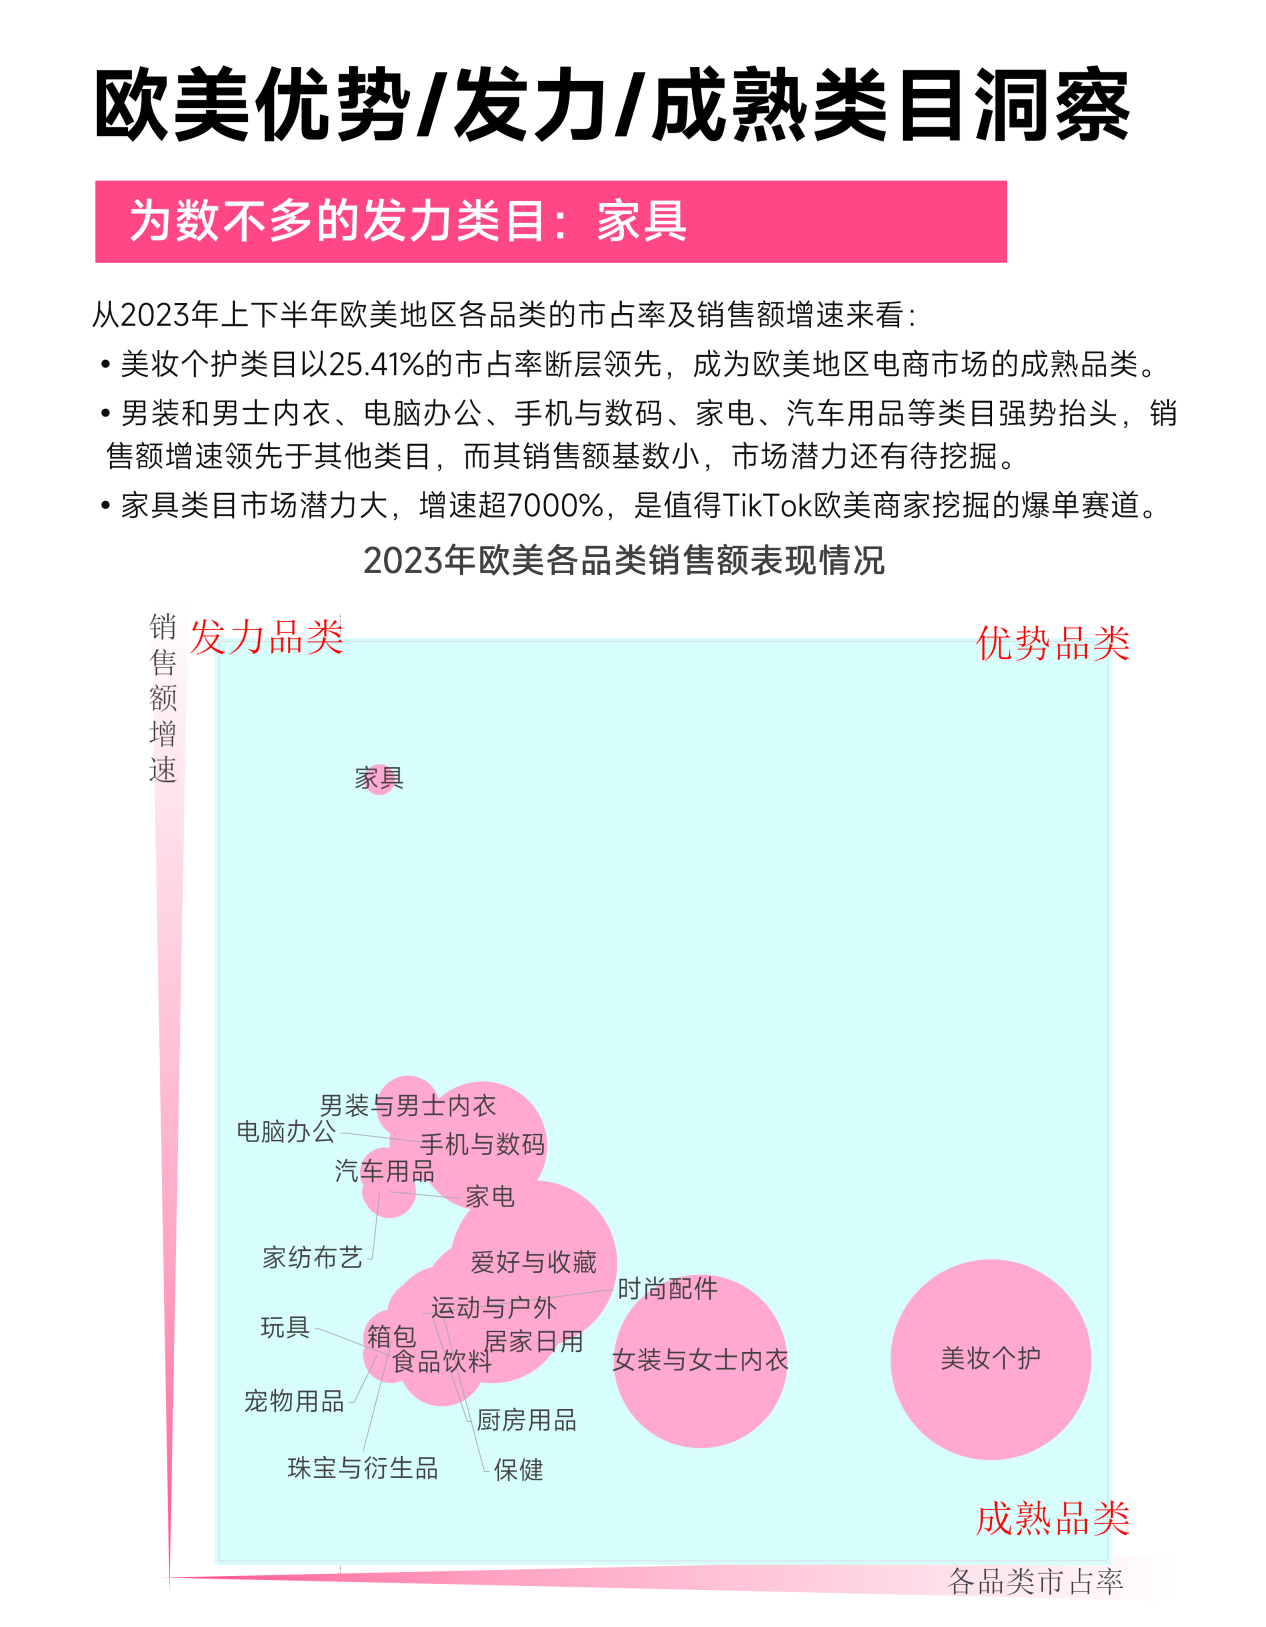
The analysis results show that the survival environment for beauty & personal care, women's clothing, and women's underwear products in the European and American markets is good, while categories such as fashion accessories, kitchenware, household daily necessities, sports and outdoor are highly competitive.
The health category became a dominant category in the U.S. market in November, and categories such as home building materials, computers & office, household daily necessities, furniture, and maternal & baby products also showed strong growth momentum.
(For product selection trends in other countries, please check private messages for the full report)
04 Annual Consumer Preferences + Pricing Strategies
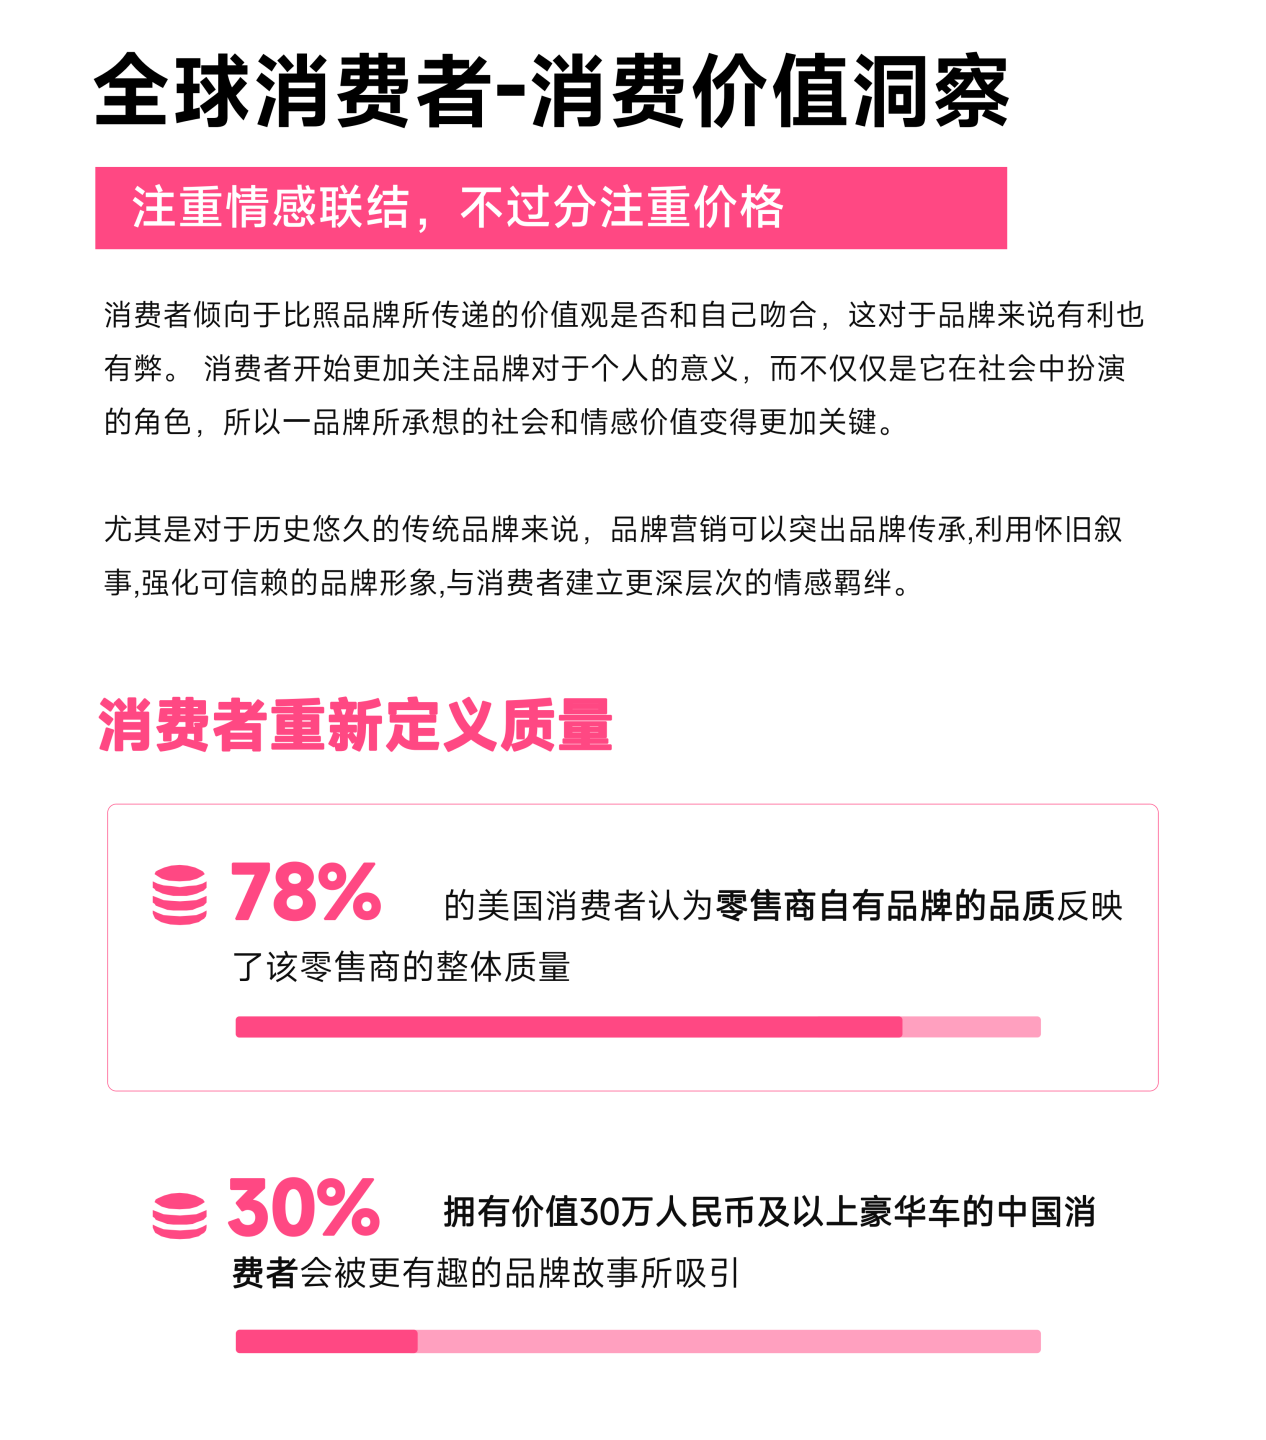
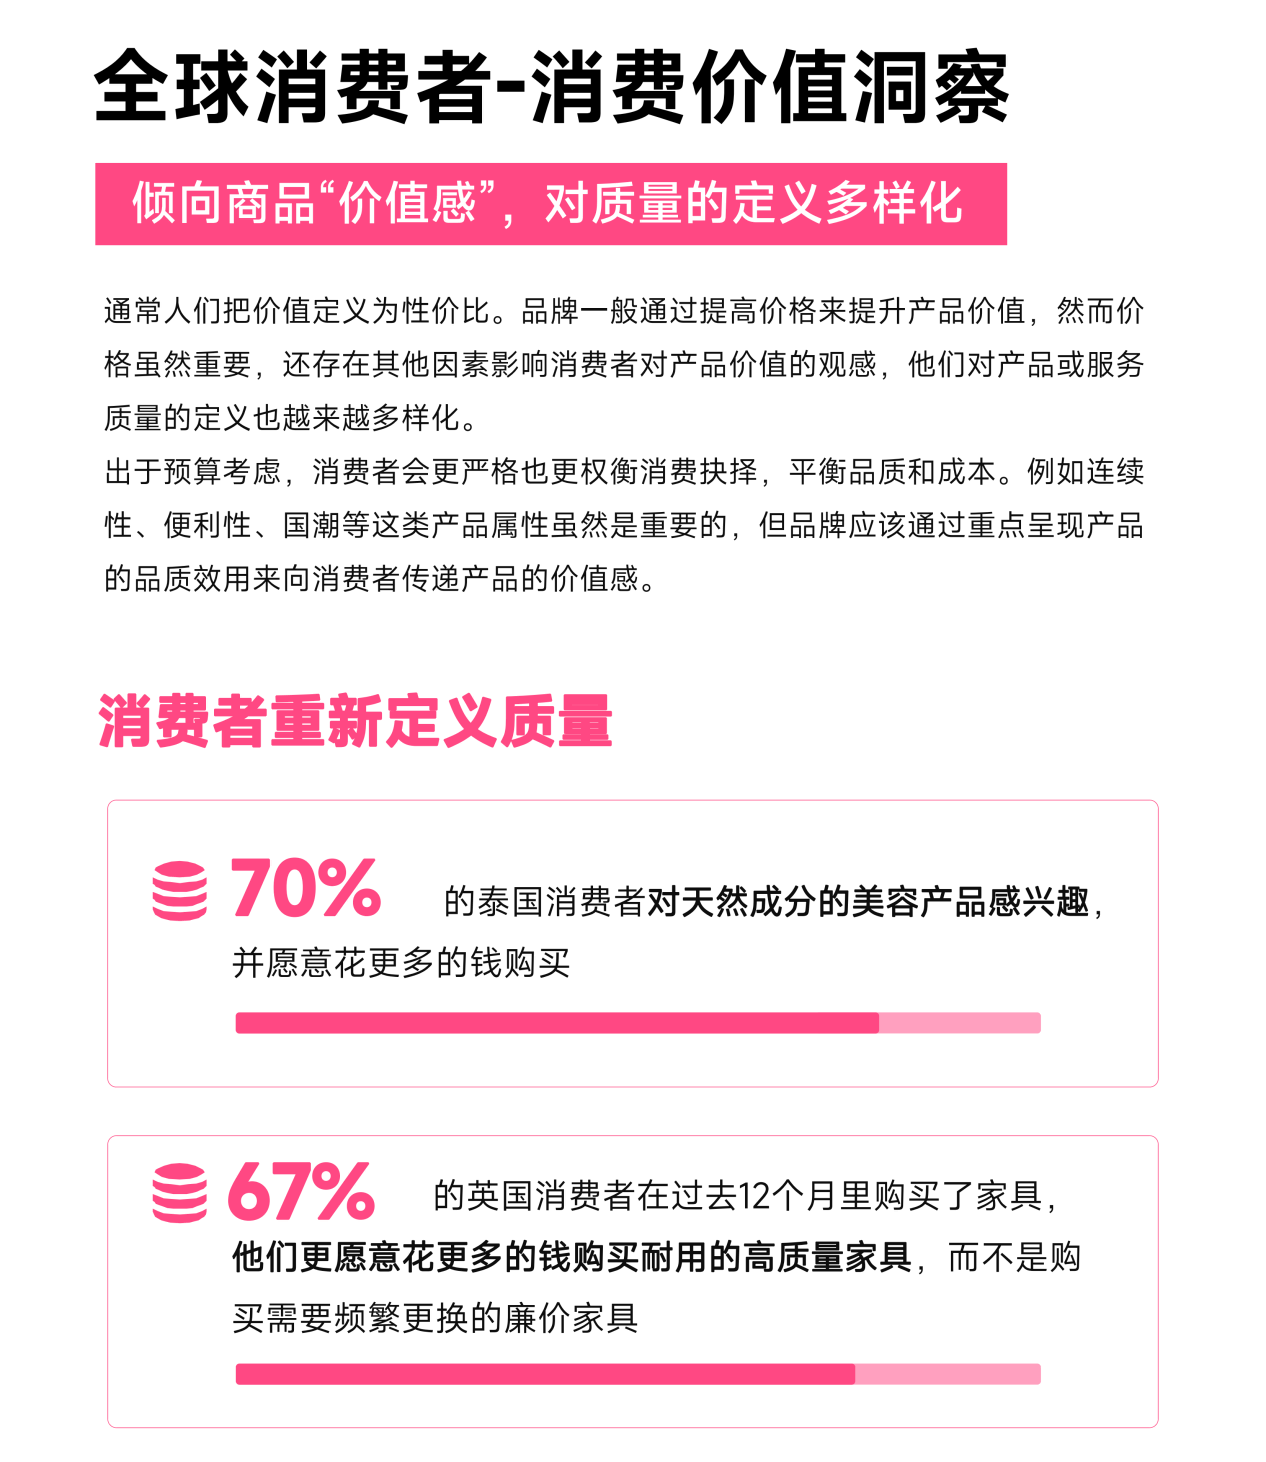
To achieve sustained growth in e-commerce, in addition to product selection, more attention should be paid to consumer needs and behavior. For cross-border e-commerce sellers, understanding consumers is key.
Through data analysis, we can gain insight into consumer preferences and thus develop more precise pricing strategies. At the same time, consumer research reports are also an important way to obtain consumer information. These data can help us better understand consumers' values and purchasing behavior.
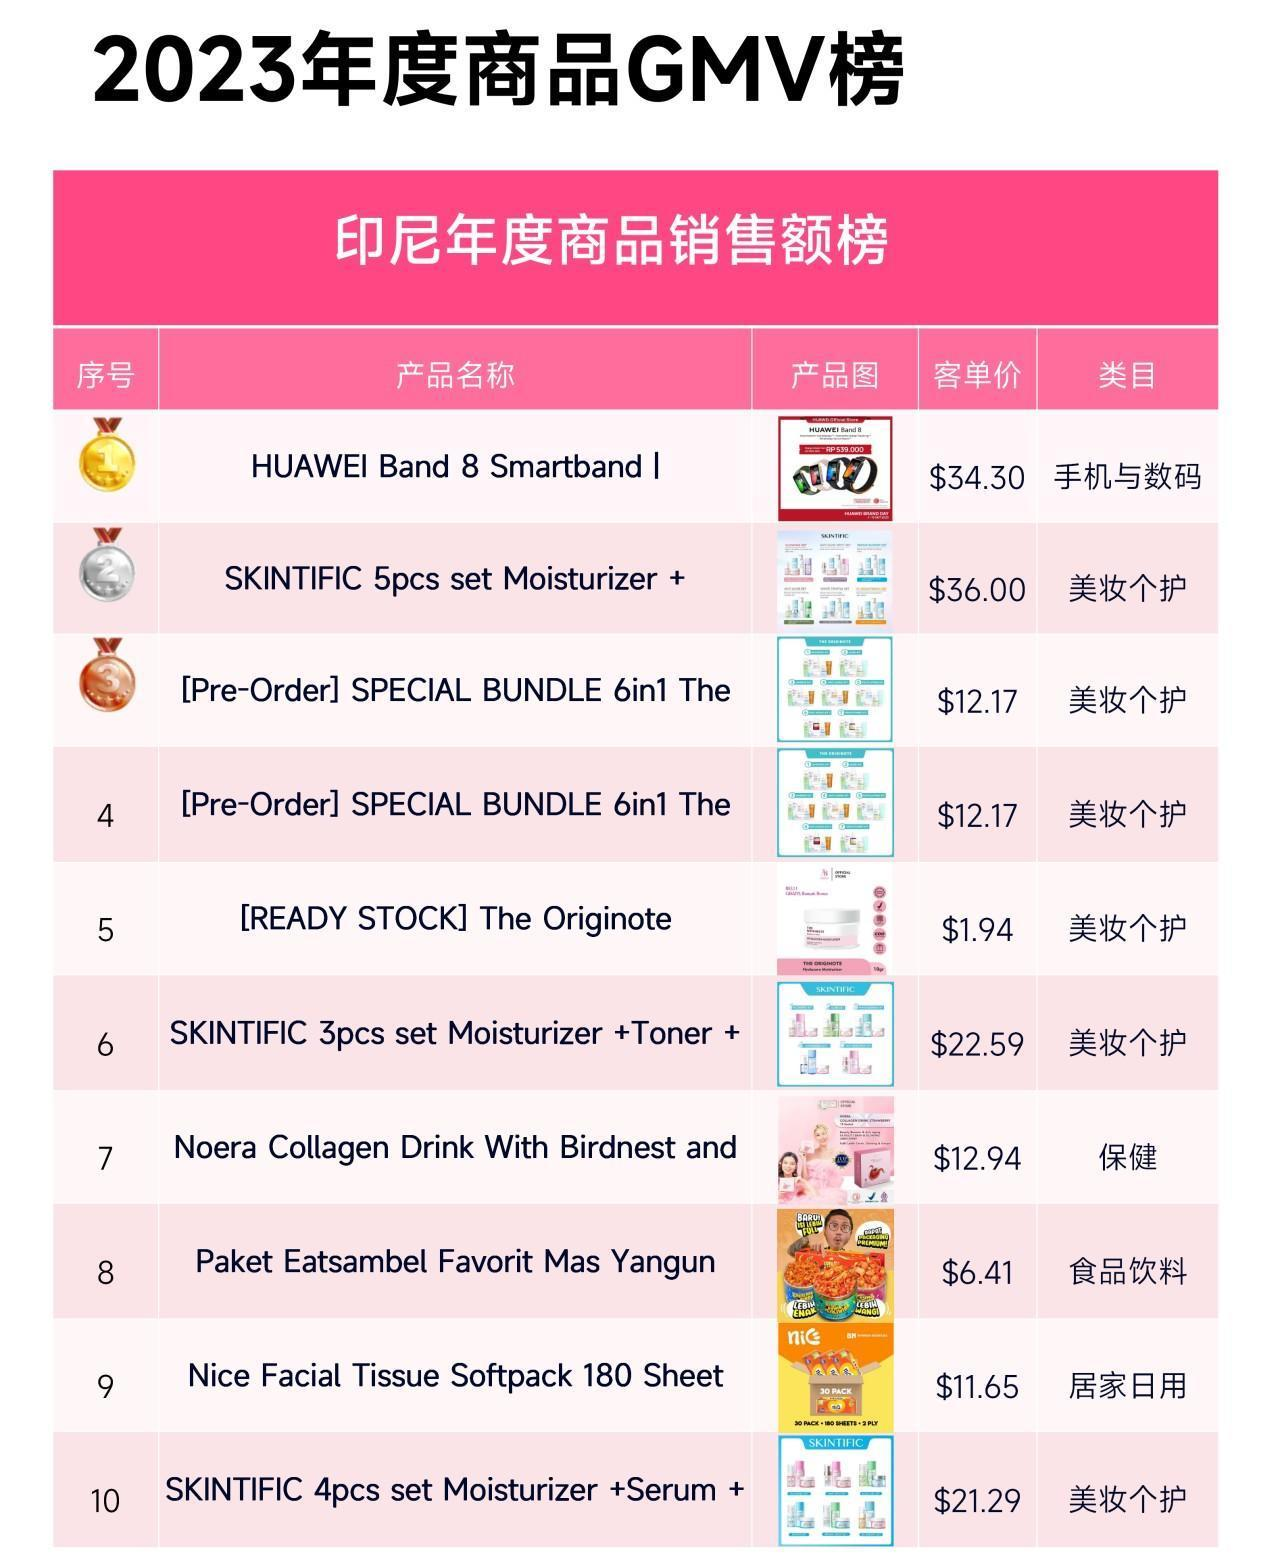
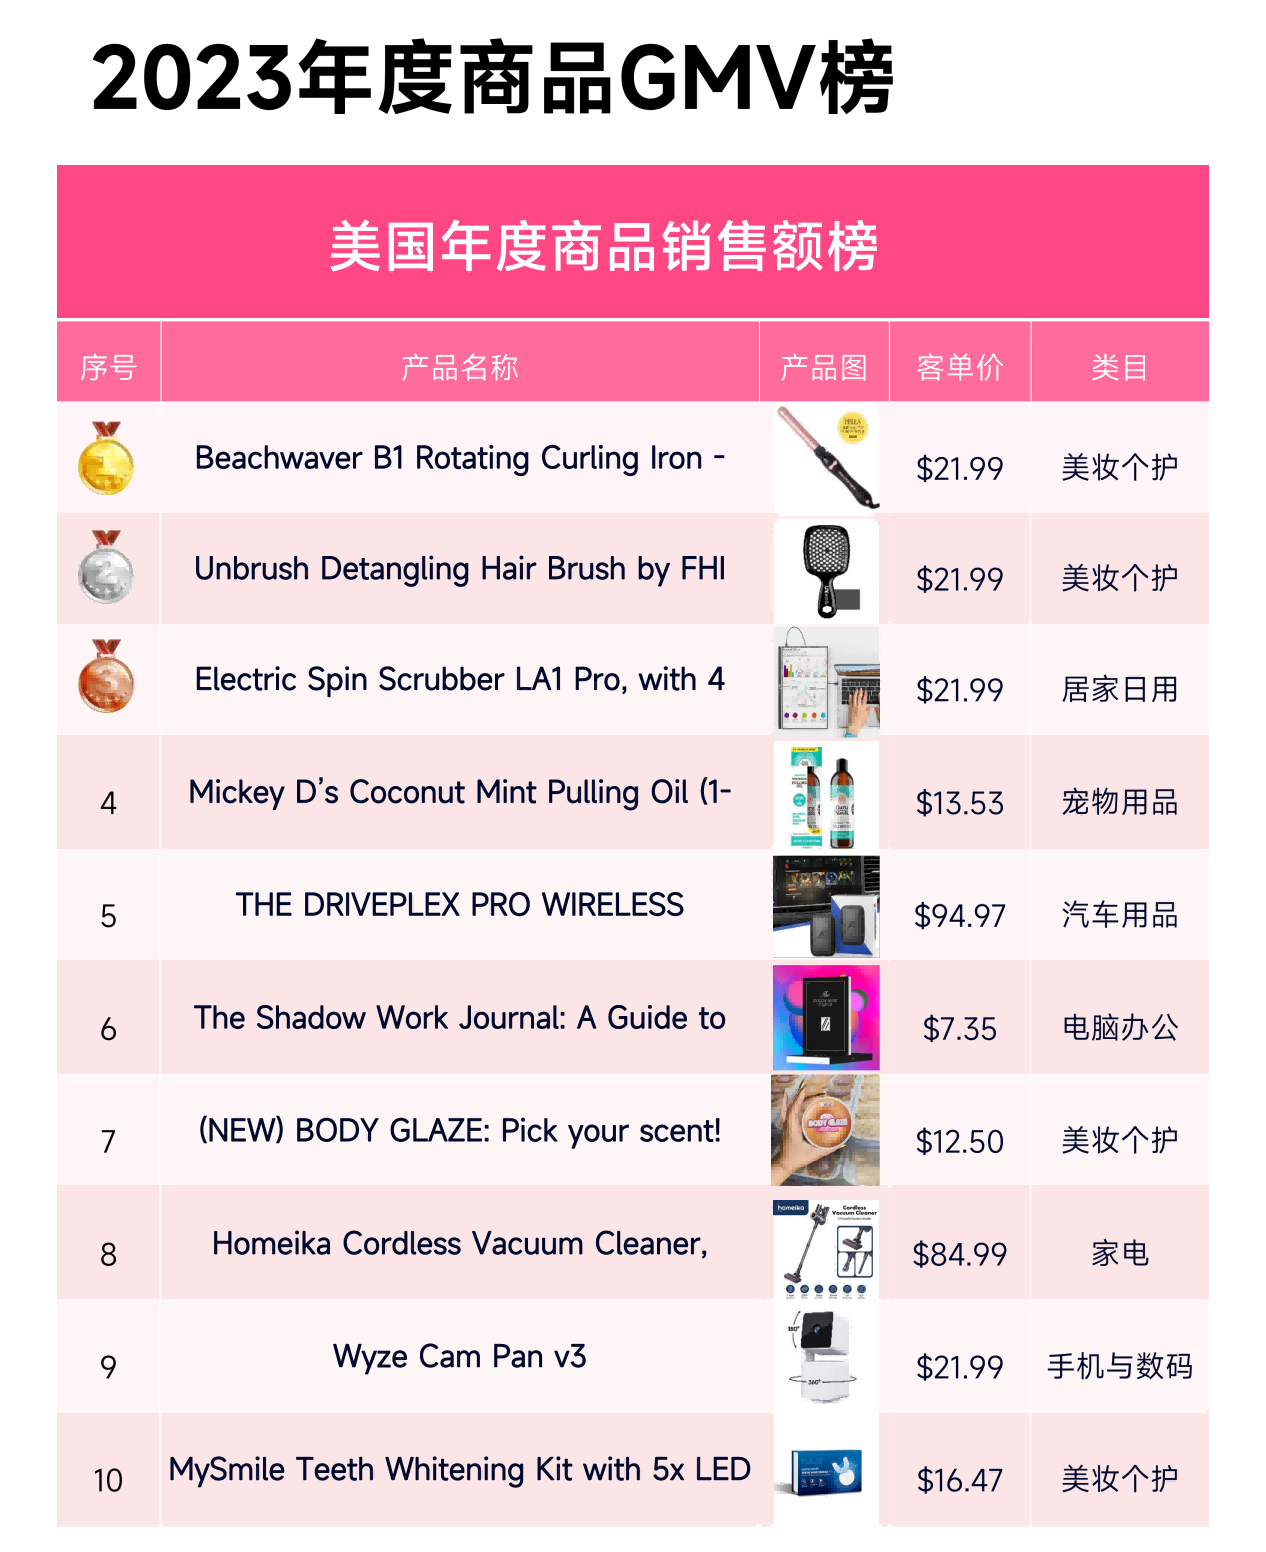
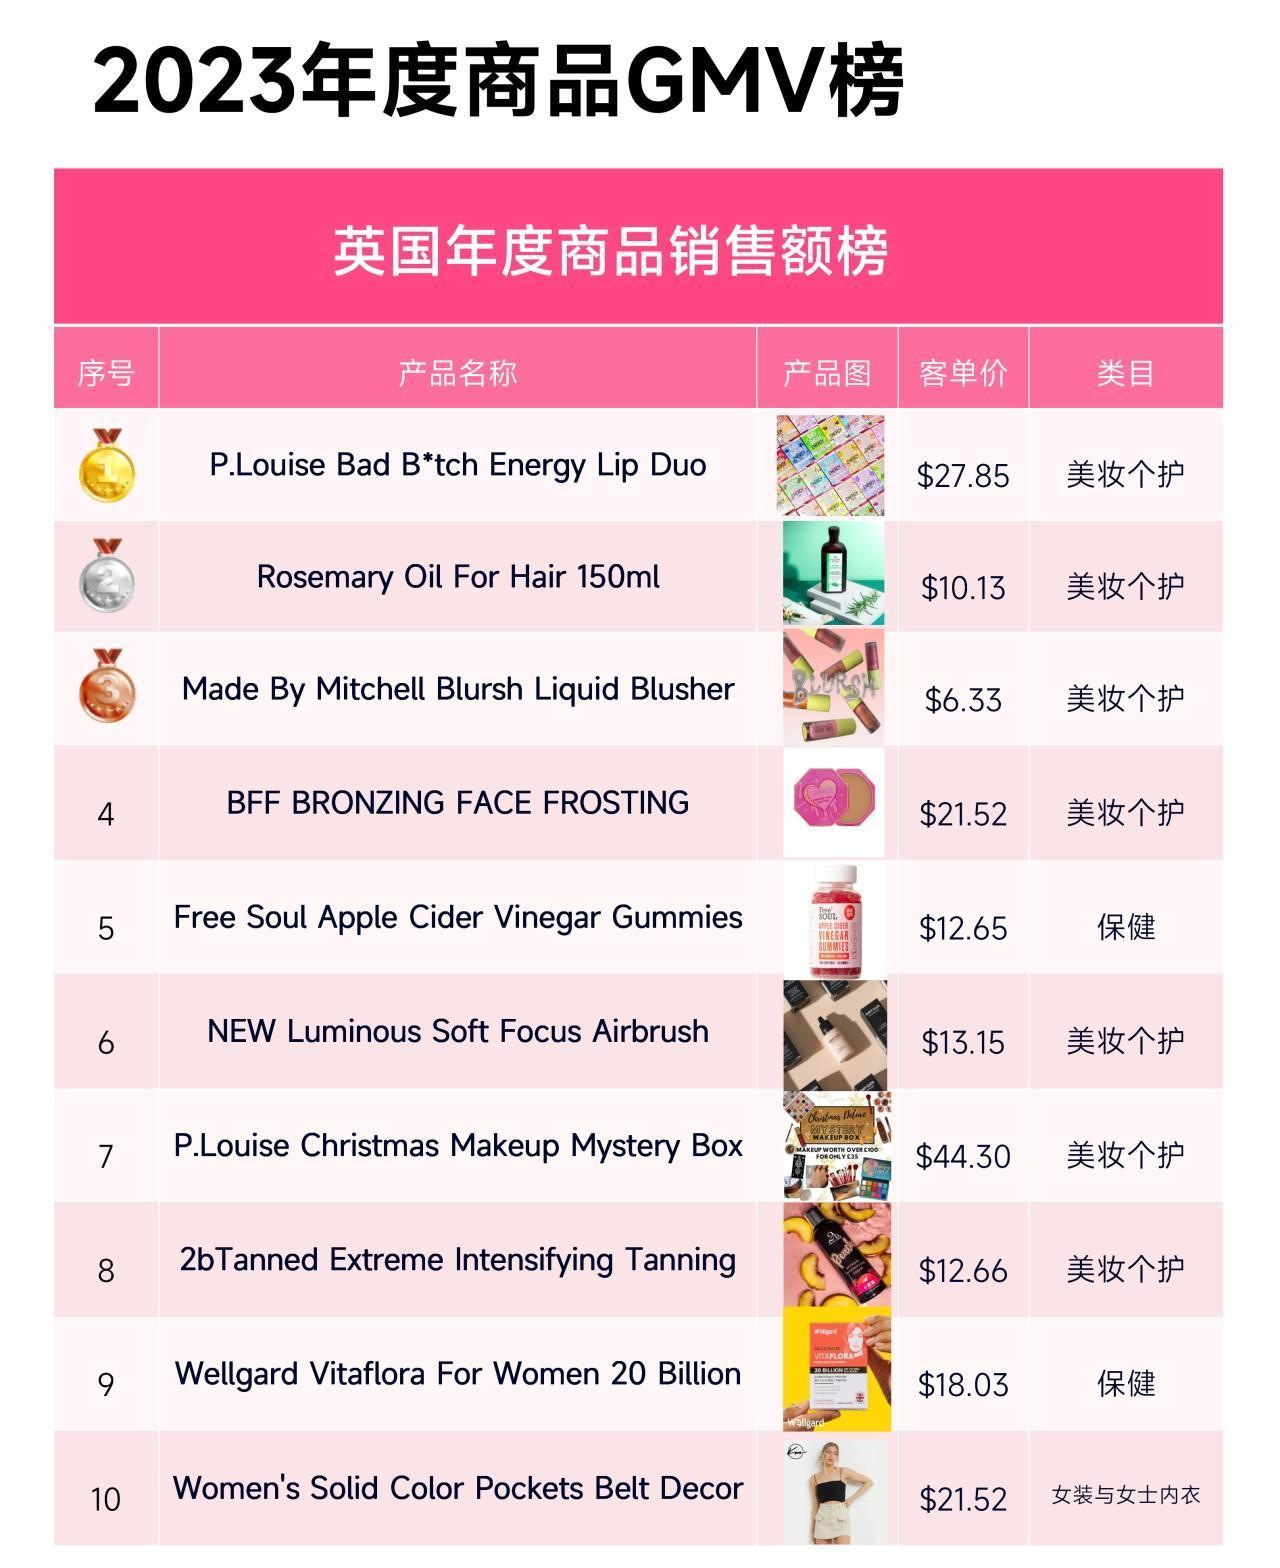
05 Tuke Sales Rankings in 2023
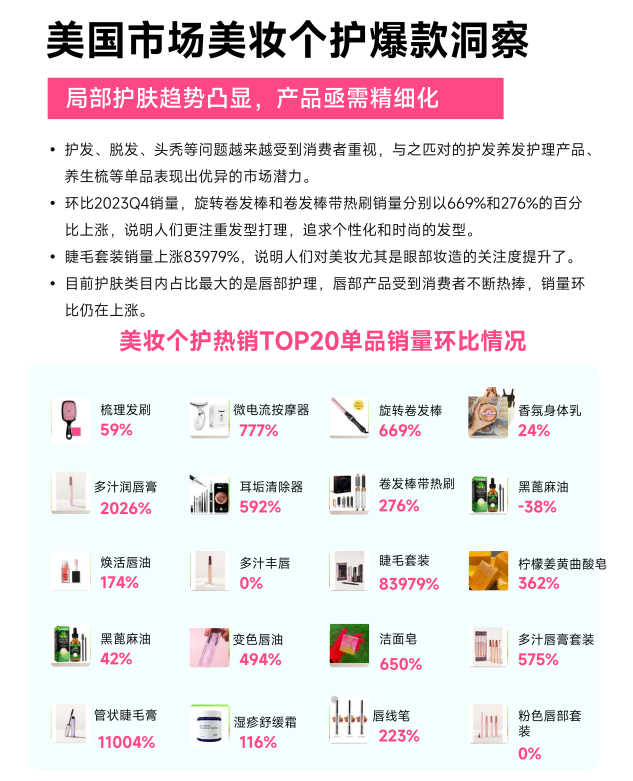
Taking product sales rankings as an example, the U.S. and Vietnamese markets performed well, covering various categories and maintaining a healthy market ecosystem. The U.S. market performed well in categories such as beauty & personal care, electronics, household daily necessities, clothing, and health. The Vietnamese market mainly focused on home appliances, beauty & personal care, food & beverages, and health categories.
In contrast, the product sales rankings in the Thai market were relatively monotonous, with the beauty & personal care category dominating, showing Thai consumers' love for beauty & personal care products.
In addition to the product sales rankings, the sales rankings of small shops and influencer sales rankings in the U.S., UK, Thailand, Indonesia, etc. can be found in the full report via private message.