This report mainly focuses on the development status of TikTok Shop in 2024, covering global user data, analysis of major markets, industry category distribution, shop and influencer data, and more, providing comprehensive data support and market insights for understanding TikTok Shop’s annual development.
1. TikTok Global Overview
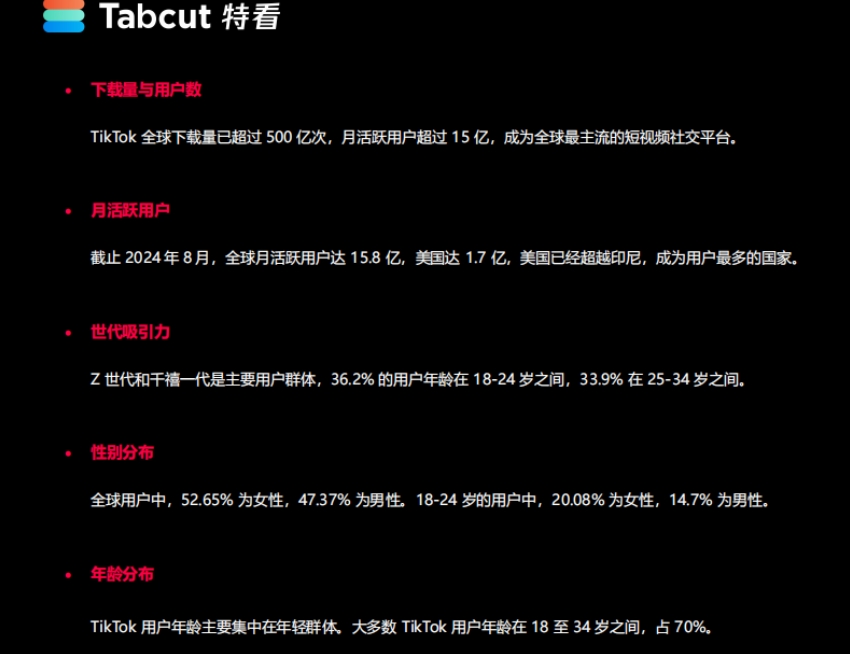
- Strong user base: Over 50 billion downloads worldwide, 1.58 billion monthly active users, with the United States surpassing Indonesia as the country with the most users. Gen Z and Millennials are the main user groups, ages concentrated between 18 - 34, and female users account for 52.65%.
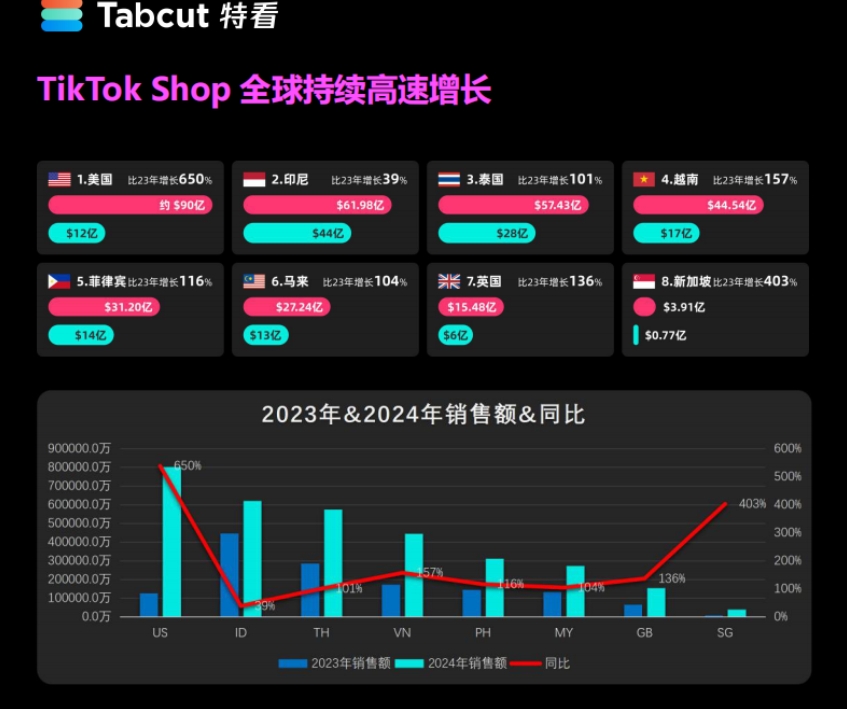
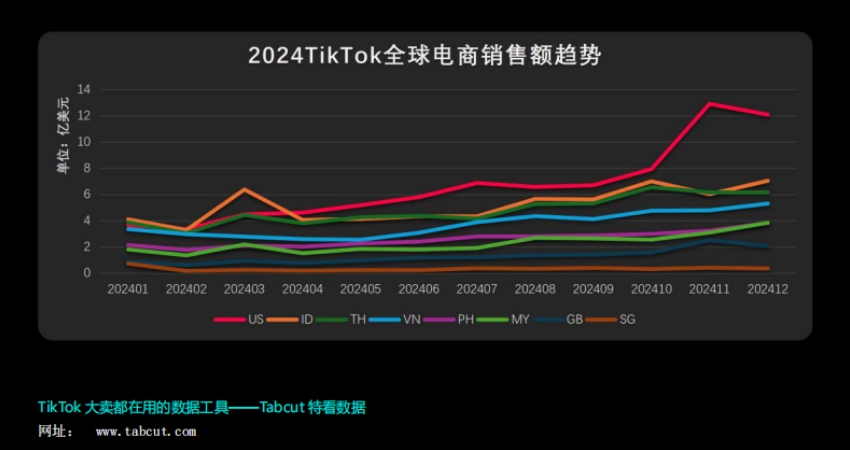
- Robust e-commerce growth: Global TTS continues to grow rapidly, with sales in various countries significantly higher than in 2023. For example, the US grew by 650%, Indonesia by 39%, etc. The second half of the year is the peak sales season for e-commerce, and the US region’s Black Friday single-day sales exceeded $100 million.
2. Major Market Analysis
- US Market: Annual sales reached about $9 billion, a year-on-year increase of 650%. The health category performed strongly, the number of products in all categories increased and overall prices decreased. There are 7,024 shops with annual sales of $100,000, and video-based sales are the main transaction method.
- UK Market: Sales exceeded $1.56 billion, a year-on-year increase of 1.4 times. Beauty & personal care and women’s clothing & lingerie ranked top two in sales, while sports & outdoor, mobile phones & digital categories showed outstanding growth.
- Southeast Asia Market: Indonesia’s sales reached $5.5 billion and are stabilizing; Thailand’s sales were $5.9 billion, with mobile phones, digital products, and health supplements accounting for a large share; Vietnam’s sales were $4.4 billion, with an average category growth rate of 166%; Malaysia’s sales were $2.8 billion, with an average category growth rate of 345%; the Philippines’ sales were $3.1 billion, with mobile phones & digital products growing 152% year-on-year; Singapore’s sales exceeded $350 million, with an average transaction price of $19, and beauty & personal care and health categories dominated.
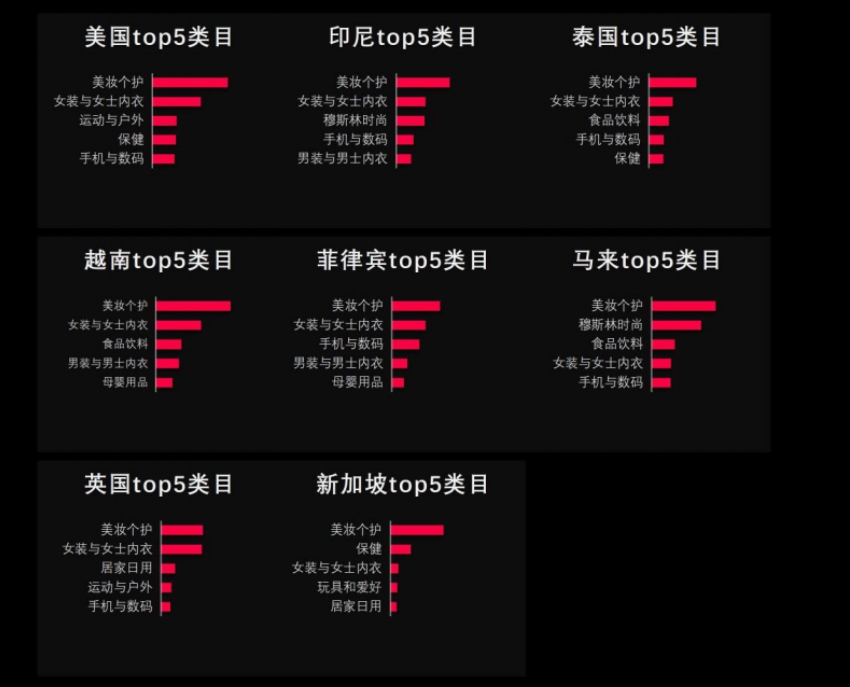
3. Industry Category Analysis: Beauty & personal care is the top category in all countries, but consumption preferences vary, such as US consumers favoring sports and health products, while some Southeast Asian countries have higher demand for food & beverages. The average transaction price in all categories is more than 47% lower than the average selling price, while furniture, jewelry, and derivatives have relatively higher selling and transaction prices.
4. Shop and Influencer Data
- Shop situation: The US has the most shops opened, Indonesia has the most active shops, and the shop closure rate in all countries exceeds 10%. The distribution of shops varies by sales range, and some countries have shops with outstanding annual sales.
- Influencer data: In the US, influencer video-based sales are the main transaction method, and influencers with different follower counts perform differently in sales. Some influencers use external links to drive traffic for merchants; in the UK, top influencers have a high proportion of live-stream sales; in each market, influencers play an important role in driving sales in different product categories.